# Nix flamegraph or profiling tool?
**URL:** https://discourse.nixos.org/t/nix-flamegraph-or-profiling-tool/33333
**Category:** Development
**Created:** [September 22, 2023, 10:57am UTC](https://discourse.nixos.org/t/nix-flamegraph-or-profiling-tool/33333 "2023-09-22T10:57:29Z")
**Posts on this page:** 15
**Page:** 1
### Author:  [@Yajo](https://discourse.nixos.org/u/Yajo)
#### Post date: [September 22, 2023, 10:57am UTC](https://discourse.nixos.org/t/nix-flamegraph-or-profiling-tool/33333/1 "2023-09-22T10:57:30Z")
I’m having a big closure that takes too much to evaluate. And it has no IFDs. That’s weird.
I’m used to using [py-spy](https://github.com/benfred/py-spy) to generate flamegraph data that I can feed into [https://www.speedscope.app/](https://www.speedscope.app/) to inspect and solve Python apps performance bottlenecks.
Is there anything similar for Nix lang?
---
### Author:  [@Artturin](https://discourse.nixos.org/u/Artturin)
#### Post date: [September 26, 2023, 12:24am UTC](https://discourse.nixos.org/t/nix-flamegraph-or-profiling-tool/33333/2 "2023-09-26T00:24:59Z")
I have this zsh function
```sh
function nixFunctionCalls {
local WORKDIR=$(mktemp -d /tmp/nix-fun-calls-XXXXX)
nix-instantiate --trace-function-calls "$1" -A "$2" 2> $WORKDIR/nix-function-calls.trace 1>/dev/null
~/nixgits/nix/contrib/stack-collapse.py $WORKDIR/nix-function-calls.trace > $WORKDIR/nix-function-calls.folded
nix-shell -p flamegraph --run "flamegraph.pl $WORKDIR/nix-function-calls.folded > $WORKDIR/nix-function-calls.svg"
echo "$WORKDIR/nix-function-calls.svg"
}
```
I use it like so `nixFunctionCalls . bash | xargs firefox`
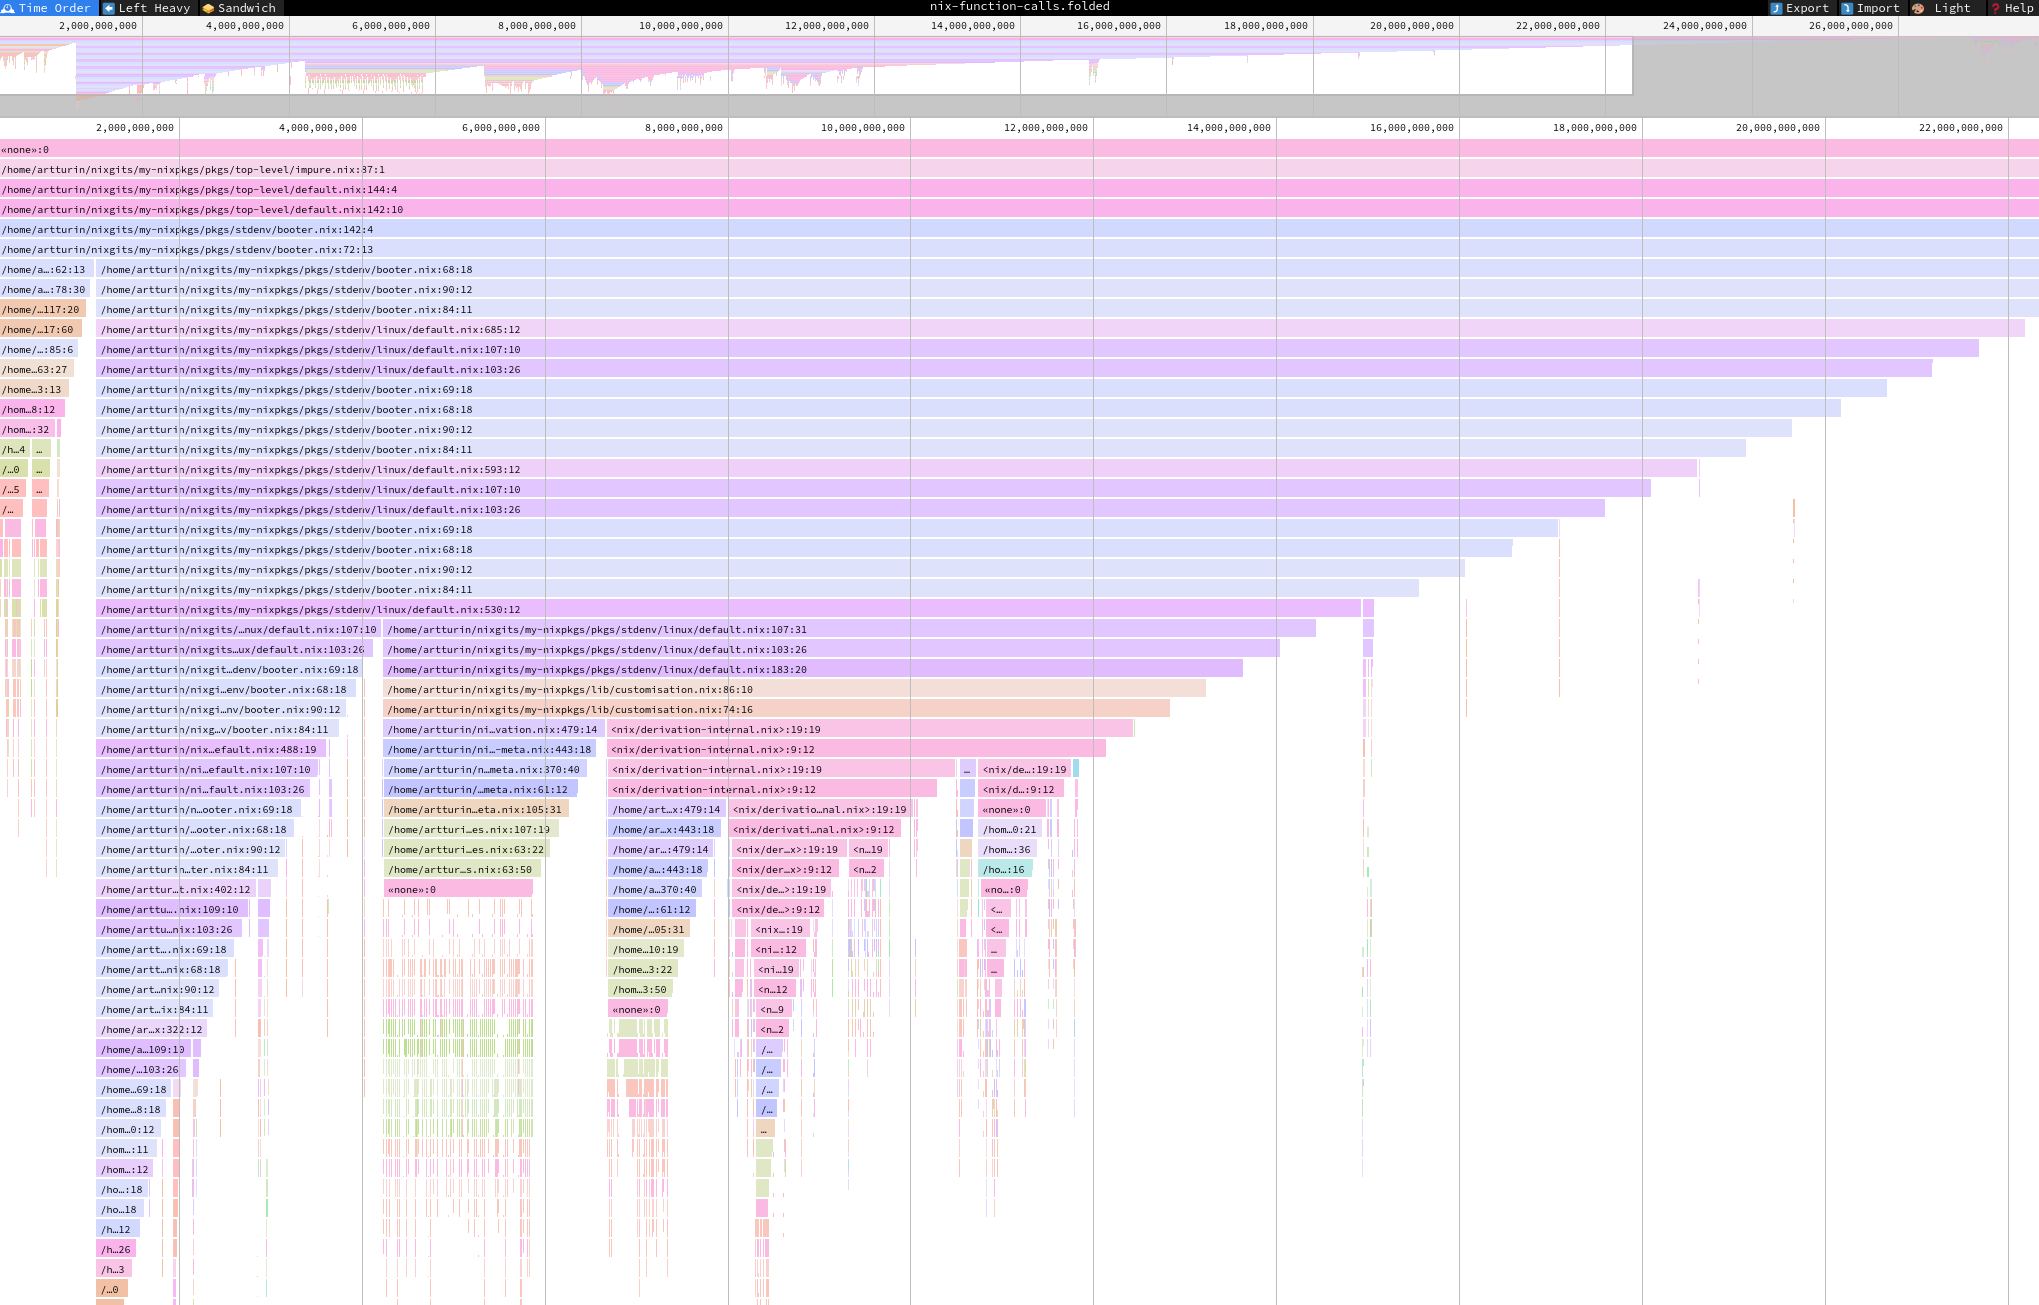
here’s the `.folded` file in speedscope
---
### Author:  [@Yajo](https://discourse.nixos.org/u/Yajo)
#### Post date: [September 26, 2023, 9:53am UTC](https://discourse.nixos.org/t/nix-flamegraph-or-profiling-tool/33333/3 "2023-09-26T09:53:36Z")
Is there a flakes alternative to `nix-instantiate`?
---
### Author:  [@Yajo](https://discourse.nixos.org/u/Yajo)
#### Post date: [September 26, 2023, 9:58am UTC](https://discourse.nixos.org/t/nix-flamegraph-or-profiling-tool/33333/4 "2023-09-26T09:58:22Z")
I’m trying your solution and a problem I find is that my `.folded` file occupies about 59 GB, so I cannot upload it to speedscope, and trying to get a local flamegraph out of it blows my machine.
Is there any other more efficient way to get a flamegraph?
---
### Author:  [@Artturin](https://discourse.nixos.org/u/Artturin)
#### Post date: [September 26, 2023, 10:11am UTC](https://discourse.nixos.org/t/nix-flamegraph-or-profiling-tool/33333/5 "2023-09-26T10:11:29Z")
Mine for the nixpkgs bash is only a few mb
I dont know of other ways
---
### Author:  [@Artturin](https://discourse.nixos.org/u/Artturin)
#### Post date: [September 26, 2023, 10:40am UTC](https://discourse.nixos.org/t/nix-flamegraph-or-profiling-tool/33333/6 "2023-09-26T10:40:05Z")
From this reply
[https://github.com/NixOS/nix/issues/7179#issuecomment-1678230028](https://github.com/NixOS/nix/issues/7179#issuecomment-1678230028)
`nix eval --trace-function-calls --raw ".#bash" 2>&1 | cat`
For some reason it has to be piped, weird bug.
---
### Author:  [@Yajo](https://discourse.nixos.org/u/Yajo)
#### Post date: [September 26, 2023, 11:03am UTC](https://discourse.nixos.org/t/nix-flamegraph-or-profiling-tool/33333/7 "2023-09-26T11:03:43Z")
py-spy has the notion of samples per second. I think that’s how they produce a reasonably-sized dump.
It seems to me that nix just traces every single call, which can amount to many millions when using modules (I have them while using flake-parts and dream2nix in the same project).
It would be nice to be able to have a “samples per second” option for `--trace-function-calls`.
---
### Author:  [@Artturin](https://discourse.nixos.org/u/Artturin)
#### Post date: [September 26, 2023, 10:52pm UTC](https://discourse.nixos.org/t/nix-flamegraph-or-profiling-tool/33333/8 "2023-09-26T22:52:51Z")
`NIX_SHOW_STATS=1 NIX_COUNT_CALLS=1` could also be helpful
---
### Author:  [@Yajo](https://discourse.nixos.org/u/Yajo)
#### Post date: [September 27, 2023, 8:06am UTC](https://discourse.nixos.org/t/nix-flamegraph-or-profiling-tool/33333/9 "2023-09-27T08:06:00Z")
Both options seem to dump useful information, but it’s not very human-readable.
Is there any tool that generates some sort of graphic out of that data?
---
### Author:  [@illustris](https://discourse.nixos.org/u/illustris)
#### Post date: [October 5, 2023, 11:10am UTC](https://discourse.nixos.org/t/nix-flamegraph-or-profiling-tool/33333/10 "2023-10-05T11:10:59Z")
> [@Artturin](#):
>
> For some reason it has to be piped, weird bug.
```auto
00000000: 0d1b 5b4b 0d1b 5b4b 6675 6e63 7469 6f6e ..[K..[Kfunction
00000010: 2d74 7261 6365 2065 6e74 6572 6564 20c2 -trace entered .
```
Nix is putting control chars in stderr for some reason. After cleaning up the control characters and passing it through [this very jank AI-generated script](https://gist.github.com/illustris/cce6cf01374917aa0d896ee34de958d5), flamegraph.pl is able to generate svgs.
EDIT: Nevermind, the script doesn’t produce correct results. But it should be easy enough to do.
---
### Author:  [@tailrecursive](https://discourse.nixos.org/u/tailrecursive)
#### Post date: [March 12, 2024, 6:43am UTC](https://discourse.nixos.org/t/nix-flamegraph-or-profiling-tool/33333/11 "2024-03-12T06:43:06Z")
Adapted to home-manager configuration, made it use `nix run` to support flakes and inferno for magnitudes faster svg generation:
```auto
home.packages =
let
# https://discourse.nixos.org/t/nix-flamegraph-or-profiling-tool/33333
stackCollapse = pkgs.writeTextFile {
name = "stack-collapse.py";
destination = "/bin/stack-collapse.py";
text = builtins.readFile (builtins.fetchurl
{
url = "https://raw.githubusercontent.com/NixOS/nix/master/contrib/stack-collapse.py";
sha256 = "sha256:0mi9cf3nx7xjxcrvll1hlkhmxiikjn0w95akvwxs50q270pafbjw";
});
executable = true;
};
nixFunctionCalls = pkgs.writeShellApplication {
name = "nixFunctionCalls";
runtimeInputs = [stackCollapse pkgs.inferno];
text = builtins.readFile ./nix-function-calls.sh;
checkPhase = "";
};
in
[nixFunctionCalls];
```
```auto
#!/usr/bin/env zsh
WORKDIR=$(mktemp -d)
nix eval -vvvvvvvvvvvvvvvvvvvv --raw --option trace-function-calls true $1 1>/dev/null 2> $WORKDIR/nix-function-calls.trace
stack-collapse.py $WORKDIR/nix-function-calls.trace > $WORKDIR/nix-function-calls.folded
inferno-flamegraph $WORKDIR/nix-function-calls.folded > $WORKDIR/nix-function-calls.svg
echo "$WORKDIR/nix-function-calls.svg"
```
---
### Author:  [@randomnixuser](https://discourse.nixos.org/u/randomnixuser)
#### Post date: [March 12, 2024, 1:54pm UTC](https://discourse.nixos.org/t/nix-flamegraph-or-profiling-tool/33333/12 "2024-03-12T13:54:34Z")
thanks a lot for posting it here, can you please explain to me why the pipe xargs command?
like in your example:
```bash
nixFunctionCalls . bash | xargs firefox
```
thanks!
---
### Author:  [@norpol](https://discourse.nixos.org/u/norpol)
#### Post date: [March 12, 2024, 1:56pm UTC](https://discourse.nixos.org/t/nix-flamegraph-or-profiling-tool/33333/13 "2024-03-12T13:56:28Z")
> [@Artturin](#):
>
> ` echo "$WORKDIR/nix-function-calls.svg"`
If you pipe this to `xargs firefox` it will be the equivalent of `firefox ./$WORKDIR/nix-functiona-calls.svg`.
---
### Author:  [@norpol](https://discourse.nixos.org/u/norpol)
#### Post date: [March 12, 2024, 2:02pm UTC](https://discourse.nixos.org/t/nix-flamegraph-or-profiling-tool/33333/14 "2024-03-12T14:02:58Z")
Some additional ongoing efforts/experiment for a Nix expr evaluation profiler using tracy:
>
>
> This is a WIP profiler for the Nix code itself, not the cpp Nix evaluator. The g…oal is to provide some tooling to improve the Nixpkgs evaluation performance.
>
> This is a WIP Nix profiler using \[Tracy\](https://github.com/wolfpld/tracy). The idea is to trace the evaluation of the expression atoms to figure out what is expensive. We are roughly tracing the thunk evaluation. Nix is a lazy language, I think this is what makes most sense.
>
> \[Short demo video\](https://social.alternativebit.fr/media/4fee7e0b64e3d7fd05102e2d3b6789099ceb506c6cd9fe4398efd5aea2e13779.nix-tracy-demo-short)
>
> \## TODO before Undrafting
>
> This is not ready yet. We need to fix at least those two issues before undrafting this PR.
>
> \*\*HELP WELCOME\*\* :)
>
> \### Elephant in the room: tracy SEGFAULTS!!!!!!!!!
>
> We have those weird "???" frames in Tracy. Hovering them with the mouse segfault the viewer.
>
> Removing the line and the column in the position pretty printer makes them go away. Sadly, removing the column and position from the trace also makes the profiler useless :D
>
> There's something very wrong in our client code, but I couldn't figure out what. For now. This is the first item on my TODO list.
>
> \### Profiler performance
>
> There's room for improvement. Random datapoint, with the profiler enabled:
> \`\`\`
> \[nix-shell:~/code-root/github.com/NixOS/nix\]$ time ./outputs/out/bin/nix-instantiate -A nixosTests.pleroma ../nixpkgs
> warning: you did not specify '--add-root'; the result might be removed by the garbage collector
> /nix/store/z6nqb4zkx59hqn00rpzpzq4fcp34y9pa-vm-test-run-pleroma.drv
>
> real 1m41,835s
> user 2m51,728s
> sys 0m11,388s
> \`\`\`
>
> Without the profiler:
> \`\`\`
> \[nix-shell:~/code-root/github.com/NixOS/nix\]$ time nix-instantiate -A nixosTests.pleroma ../nixpkgs
> warning: you did not specify '--add-root'; the result might be removed by the garbage collector
> /nix/store/z6nqb4zkx59hqn00rpzpzq4fcp34y9pa-vm-test-run-pleroma.drv
>
> real 0m12,478s
> user 0m9,998s
> sys 0m1,431s
> \`\`\`
>
> That's not a surprise, I did not make any effort here, each profiler macro is generating \*\*at least\*\* 3 allocations.
>
> We should run perf on this and see what's wrong.
>
>
> \### Move out the trace macros from the eval call sites
>
> See https://github.com/NixOS/nix/pull/9967#issuecomment-1933695607
>
> \### Is this useful/refine design?
>
> We should spend some time using this profiler. Can we spot issues with it? Can we remove some useless noise from the traces?
>
> There's no magic trick here, we need to spend time using the tool to improve it.
>
> \## How to test?
>
> 1. \`nix build github:picnoir/nix/pic/tracy-profiler\`
> 2. Open tracy. \`nix-shell -p tracy\`. Then, either lauch the graphical profiler to watch the capture in real time (\`tracy\`), either record the run through the headless capture utility (\`capture -o capture.tracy\`).
> 3. Evaluate something with the \`nix-instantiate\` utility you built in step 2. EG. \`./result/bin/nix-instantiate -A nixosTests.pleroma path-to/nixpkgs/\`
> 4. Enjoy the \[operation game\](https://en.wikipedia.org/wiki/Operation\_(game)), avoid the \`???\` with your mouse to prevent segfaults. Scroll-wheel to zoom/unzoom, left click to move the trace.
>
>
> \# Priorities and Process
>
> Add :+1: to \[pull requests you find important\](https://github.com/NixOS/nix/pulls?q=is%3Aopen+sort%3Areactions-%2B1-desc).
>
> The Nix maintainer team uses a \[GitHub project board\](https://github.com/orgs/NixOS/projects/19) to \[schedule and track reviews\](https://github.com/NixOS/nix/tree/master/maintainers#project-board-protocol).
---
### Author:  [@ada](https://discourse.nixos.org/u/ada)
#### Post date: [December 4, 2024, 9:31pm UTC](https://discourse.nixos.org/t/nix-flamegraph-or-profiling-tool/33333/15 "2024-12-04T21:31:30Z")
in case any of you are interested, I went ahead and cobbled together the scripts @tailrecursive posted into an easily accessible nix flake. You can find it here: [GitHub - crabdancing/nix-flamegraph: Various primitive scripts cobbled together to produce an easy flamegraph of nix eval](https://github.com/crabdancing/nix-flamegraph)