Nix has gained a reputation for being slow. Evaluating a NixOS configuration or large Nix dev shell can take several, even dozens of seconds. But it wasn’t always that way:
This graph shows how long it takes to evaluate the attribute nixos.closures.ec2.x86_64-linux in nixos/release-combined.nix for NixOS releases from 15.09 to 25.05, using Nix 2.28.3 and 2.5.1, and with and without the Nix daemon.
A few conclusions are evident:
NixOS evaluation has become massively slower, going from around 0.4s to around 3s for a fairly minimal configuration.
Nix has seen significant performance improvements, but to paraphrase Niklaus Wirth, NixOS is getting slower faster than Nix is getting faster.
The overhead of going through the Nix daemon has become much more pronounced.
This isn’t specific to this particular NixOS configuration - attributes like nixos.closures.kde.x86_64-linux and nixos.closures.lapp.x86_64-linux show a similar development. And it isn’t just NixOS that’s getting slow: the core of Nixpkgs has become a lot slower, as witnessed by the time to evaluate nixpkgs.stdenv.x86_64-linux:
I don’t have much insight into the sources of the slowdown. It would be great if Nix had better performance profiling tools. Regardless, the above suggests that if we want to improve the Nix user experience, it’s best to focus on the NixOS/Nixpkgs side rather than the evaluator.
pkgs/by-name was introduced in 2023? could there be a correlation with the bigger increase? in 23.05? maybe the other growth is connected to the growing number of packages?
but those are just guesses, I didn’t do any deeper investigation.
Somewhat related: Just looked at the metrics job on hydra and in addition to absolute performance regressions there is suddenly also a way higher variance of eval time since a couple of months: Making sure you're not a bot!
TL;DR: it’s now scheduled to random machines that also have random load by other jobs, contrary to some of the past years, so timings are not reliable anymore.
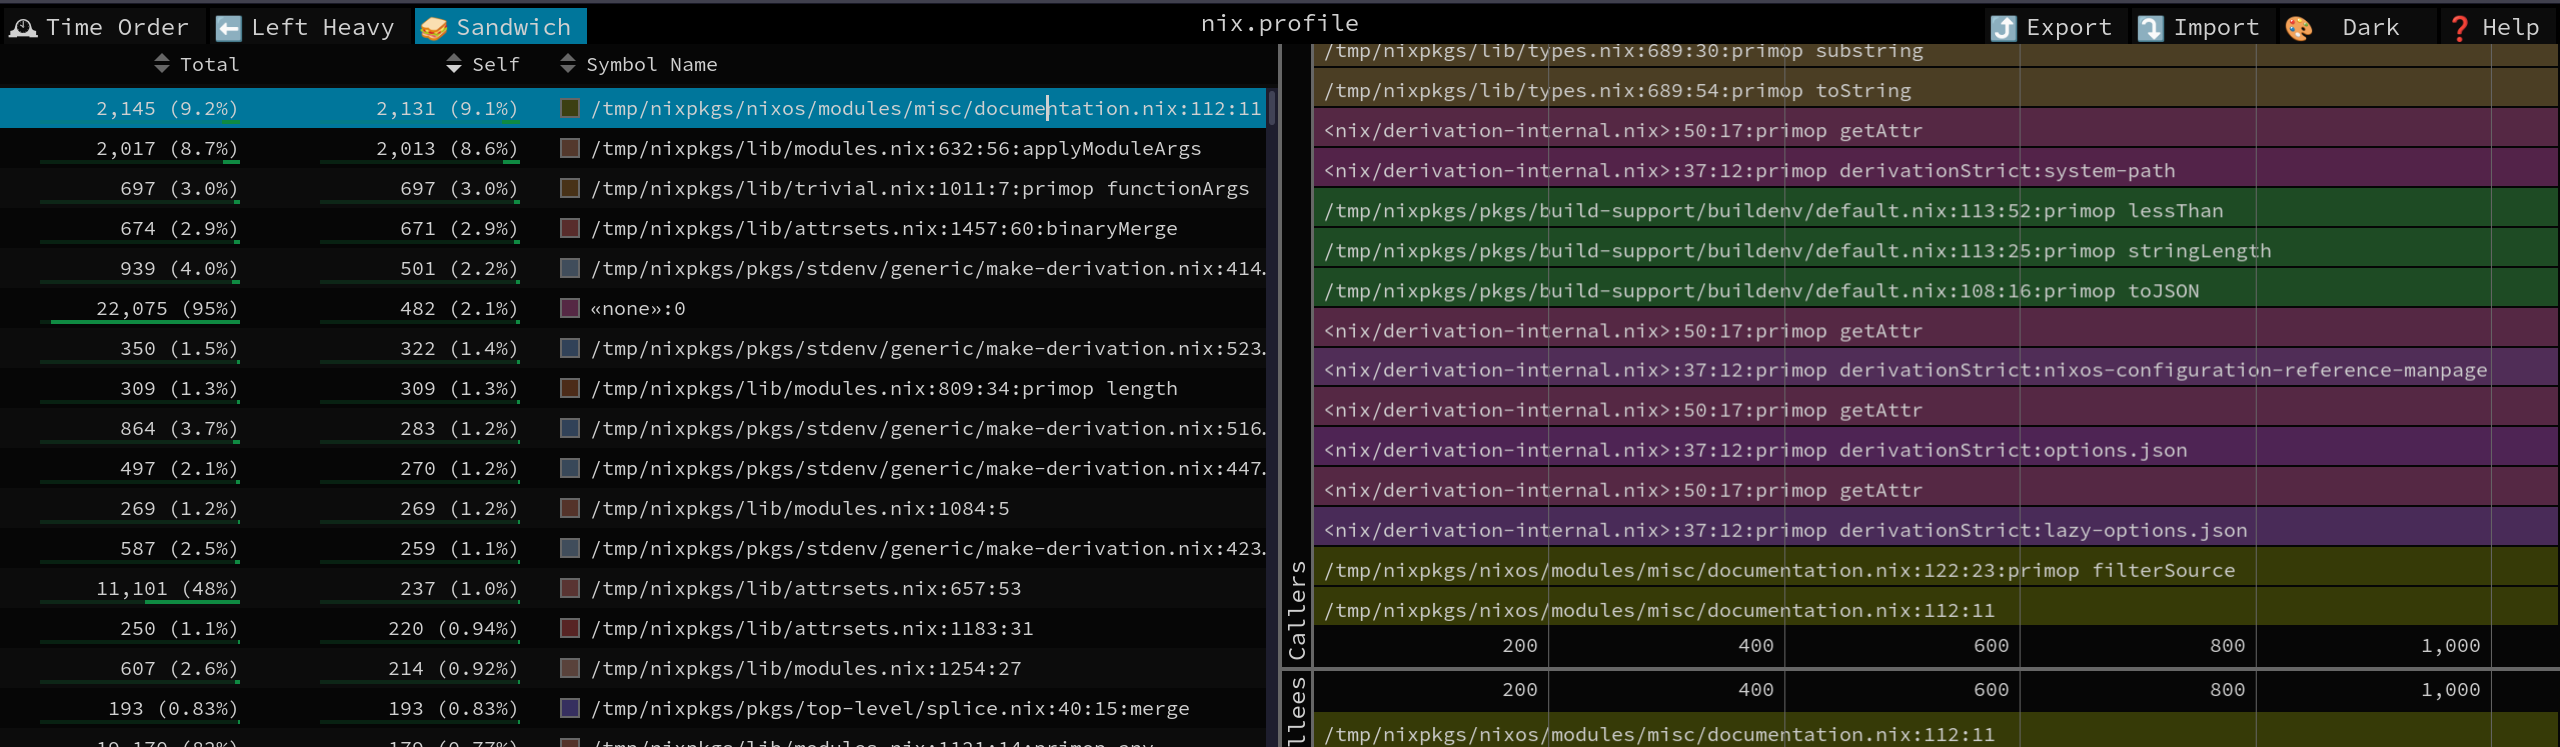
Looking specifically at nixos.closures.ec2.x86_64-linux it looks like documentation generation is quite a heavy hitter and spends a bunch of time doing source filtering:
GC_INITIAL_HEAP_SIZE=8g nix-instantiate nixos/release-combined.nix -A nixos.closures.ec2.x86_64-linux --eval-profiler flamegraph --eval-profiler-frequency 10000
I wouldn’t be surprised that the overhead mostly comes from string comparisons for the type string (a.k.a. “directory”, “symlink” e.t.c.). Those symbols are stored in the SymbolTable, but the string comparison could no doubt be optimized (e.g. when allocating a string we could first check if it’s available in the SymbolTable) and then just skip the allocation altogether (as in Optimize symbol table by NaN-git · Pull Request #13258 · NixOS/nix · GitHub). With that string comparison could just become a simple pointer equality check for those strings.
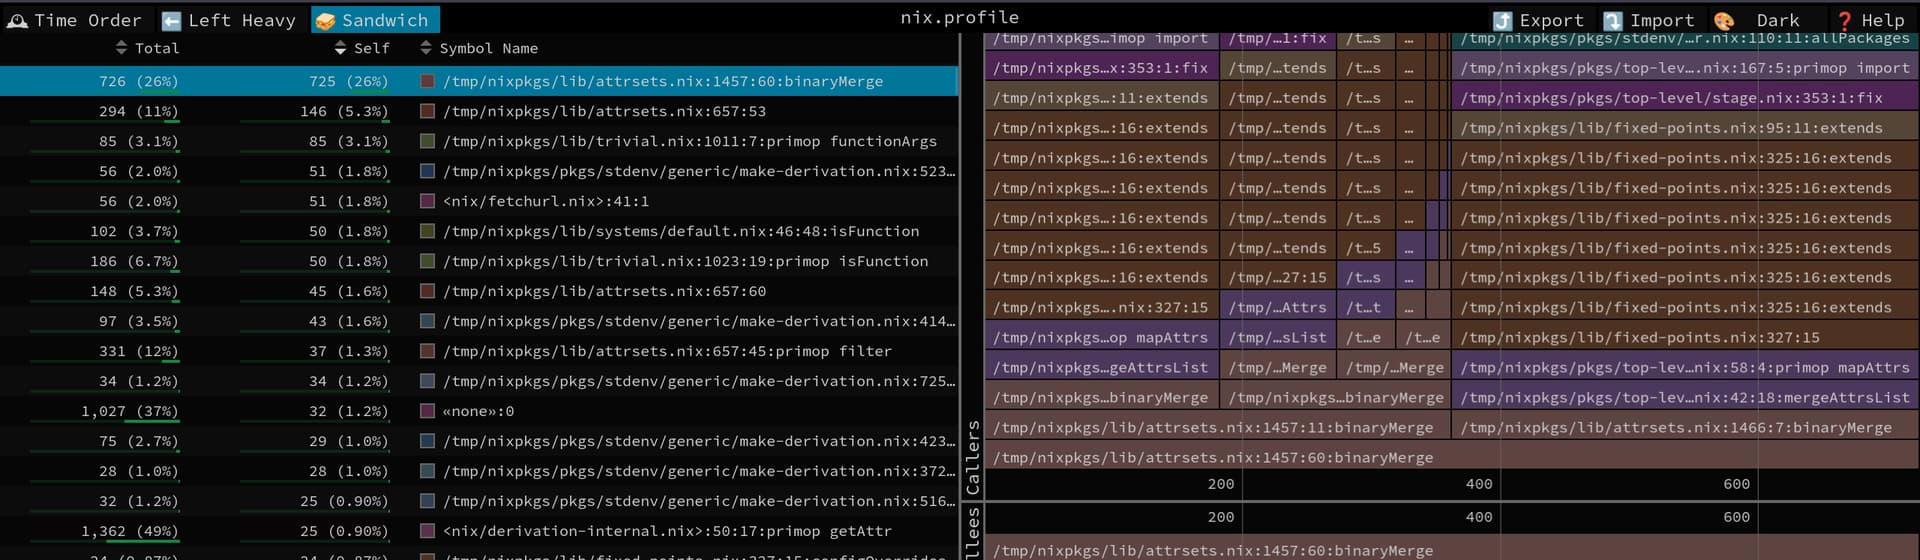
As for the stdenv eval being slow we have by-name-overlay to blame partly:
Since nix doesn’t provide an effecient list of attrs merging builtins nixpkgs has to resort to rolling our own binaryMerge. We can do much better in the evaluator (I’ve build upon Robert’s work from Prototype: accumulate attrset updates, perform k-way merge by roberth · Pull Request #11290 · NixOS/nix · GitHub here: Commits · xokdvium/nix · GitHub and was able to shave off some time spent in the by-name-overlay merging). By providing a more efficient builtin like mergeAttrsList we could somewhat mitigate the by-name performance implications. (haven’t yet pushed the builtin PoC to the branch). On the other hand, maybe the need for eager attrset merging that has to be done by the overlay is far from optimal. There were some prior art about making attrs lazy by attribute names: Lazy attribute names · Issue #4090 · NixOS/nix · GitHub
When fixing a bug on pkgs/by-name shards, it did seem that the code introduced with pkgs/by-name is a very hot path where making even minor changes lead to drastic runtime impacts, so there is likely potential for some runtime improvements there, e.g. checks that can be done elsewhere.
It’s also possible that some slow patterns have been introduced into Nixpkgs, but that the evaluator could be optimized more for those patterns instead of backing them out of Nixpkgs.
Either way, though, first step is to identify the patterns.
I had kinda wondered about this but wasn’t sure how to measure it. Specifically, I’m curious about the IO overhead of by-name. With all-packages.nix, no other files need to be opened until the package is evaluated. But with by-name, we necessarily must traverse the entire by-name tree to identify the package names that exist. You might think that we’re trading reading the large directory hierarchy to avoid reading a larger all-packages.nix. But all-packages.nix is a single, sequential, compressible file, which is a very good case scenario for file systems, especially ones with transparent compression. Reading a large directory hierarchy isn’t the most punishing thing you can do to a file system, but it’s certainly not trivial. I would expect measurable IO overhead caused by by-name.
I measured the impact of pkgs/by-name when I created https://github.com/NixOS/nixpkgs/pull/211832 (Jan 2023) and concluded it was not much (didn’t write down more details apparently, but iirc it was 60ms). I also just tried it on the PR, and the numbers to run nix-instantiate nixos/release.nix -A closures.ec2.x86_64-linux on my machine are:
Without the PR (no pkgs/by-name): 3.247 s ± 0.069 s
With the PR (~11k packages in pkgs/by-name): 3.289 s ± 0.121 s
So it barely affects the time if at all. For completeness:
On a recent Nixpkgs (~17k packages in pkgs/by-name): 5.216 s ± 0.500 s
If you really want to benchmark pkgs/by-name specifically though, you should look at nix-instantiate --eval -E 'builtins.seq (import ./. {}) null', which measures how long it takes to determine all top-level attributes:
Without the PR: 107.7 ms ± 12.6 ms
With the PR: 160.7 ms ± 23.7 ms
On a recent Nixpkgs: 250.3 ms ± 6.8 ms
So unless I made a mistake, pkgs/by-name should only be responsible for about 100-150ms, which leaves the other ~2 seconds (from that PR on Jan 2023 to May 2025) up in the air.
I want to point out that since recently, the eval performance reports (link to one from a PR) are available again thanks to @hsjobeki. Due to how evaluation is done in parallel chunks now though, this only shows up if the list of packages didn’t change. This probably isn’t the ideal tool for detecting performance regressions ahead of time, but it’s better than nothing.
@infinisil It’s worth noting that file system caches in memory have an effect. After a cold boot, time find pkgs/by-name -mindepth 2 -maxdepth 2 > /dev/null took 403 milliseconds, and my file system is a ZFS array on two relatively fast SSDs. For single drives or for slower drives the cost would be significantly larger after a cold boot or after the directory listings are purged from the page cache / ARC.
Still, these numbers are a little better than I expected.
In addition to looking for problems, it would be interesting to understand what was done between 21.05 and 22.05 that made such an improvement there, even if temporary.
To make allusion a little more clear, I believe Raito is attributing the giant improvement to @pennae’s change here.
It’s a fascinating commit, and the associated PR demonstrates how easy it is to cause channel-breaking changes even with substantial review.
I’m interested in reviewing changes that are in PR-heck right now which might produce similar performance gains. Please add me (@philiptaron) on them with a note about this thread.