Configuring VictoriaMetrics with Grafana for Metrics on NixOS

I’m trying to set up logging for my server with vmagent, VictoriaMetrics and Grafana on NixOS.

I want to try and get logging for basic system health and eventually for log files into Grafana. My configuration files are as following.

# vmagent.nix
{ config, pkgs, systemSettings, userSettings, ... }:

{
    services.vmagent = {
        enable = true;
        remoteWrite.url = "http://127.0.0.1:8428/api/v1/write";
        prometheusConfig = {
            global = {
                scrape_intervals = "10s";
            };
            scrape_configs = [
                {
                    job_name = "node-exporter";
                    # stream_parse = true;
                    # scrape_interval = "10s";
                    static_configs = [ { targets = ["127.0.0.1:9100"]; } ];
                }
                {
                    job_name = "victoriametrics";
                    # stream_parse = true;
                    # scrape_interval = "10s";
                    static_configs = [ { targets = ["http://127.0.0.1:8428/metrics"]; } ];
                }
            ];
        };
    };

    services.prometheus.exporters.node.enable = true;
}
# victoriametrics.nix
{ config, pkgs, systemSettings, userSettings, ... }:

let
    helpers = import ../../helpers.nix { nixpkgs = null; home-manager = null; };
    url = systemSettings.extraSettings.privateUrl;
in
{
    # Default port: 8428
    services.victoriametrics = {
        enable = true;
    };
}
{ config, pkgs, systemSettings, userSettings, ... }:

let
    helpers = import ../../helpers.nix { nixpkgs = null; home-manager = null; };
    url = systemSettings.extraSettings.privateUrl;
in
{
    # https://wiki.nixos.org/wiki/Grafana
    services.grafana = {
        enable = true;
        settings = {
            server = {
                http_addr = "127.0.0.1";
                http_port = 2345; # default: 3000
                enable_gzip = true;
            };
            security.admin_email = systemSettings.extraSettings.email;
            analytics.reporting_enabled = false;
        };

        provision = {
            dashboards.settings.providers = [{
                name = "Overview"; options.path = "/etc/grafana-dashboards";
            }];

            datasources.settings.datasources = [
                {
                    name = "VictoriaMetrics";
                    type = "victoriametrics-metrics-datasource";
                    access = "proxy";
                    url = "http://127.0.0.1:8428";
                    isDefault = true;
                }
                {
                    name = "VictoriaMetrics - Prometheus";
                    type = "victoriametrics-metrics-datasource";
                    access = "proxy";
                    url = "http://127.0.0.1:8481/select/0/prometheus";
                    isDefault = false;
                }
            ];
        };
    };
}

When I then go into Grafana though it says “NoData” for everything. I think I’m missing something obvious, but I’ve not found any documentation that helped me understand what I’m doing wrong.

It must probably be something with vmagent though

If you’re on 24.11, you need to use the Prometheus data source for Grafana, or at least that’s how I had to have it configured. In the last two or so months, Victoria Metrics paid the ransom (The VM dev told me it was like $70K USD) to get the VM plugin in the Grafana plugin store (or whatever its called), and while I see it in Grafana, I haven’t been able to install it. I don’t see that you’ve included any plugins in your Grafana config, you might want to try that was well, see “Declarative Configurations” here: Grafana - NixOS Wiki

Alternatively, install the plugin you’re talking about:

services.grafana.declarativePlugins = [
  pkgs.grafanaPlugins.victoriametrics-metrics-datasource
];

This is the list of nixpkgs-packaged ones: nixpkgs/pkgs/servers/monitoring/grafana/plugins/plugins.nix at 60e405b241edb6f0573f3d9f944617fe33ac4a73 · NixOS/nixpkgs · GitHub

Other settings look mostly ok, but note that vmagent is supposed to add the /metrix path itself; you define hosts not URLs.

I’m also pretty sure this can’t work - how are you supposed to read the prometheus-compatible endpoint with the victoriametrics data source?

If it still doesn’t work after you fix the missing plugin, check the logs in the journal.

2 Likes

oh it got backported in, that’s awesome!

Hi, thanks for the replies.

I forgot to mention that I had the VictoriaMetrics plugin added non-declaratively, though now I’ve added it declaratively like @TLATER showed.

The Grafana datasources were adapted from the plugin page here under “Configuration via file”.

The reason the scrape_config looks like it does is because in the Victoria Metrics docs it configured them like that.

In the logs it seems like it discovers the targets, but they won’t show up on VictoriaMetrics’s targets list, so I’m assuming the issue comes from vmagent not communicating properly with the VictoriaMetrics instance.

...
starting service discovery routines...
started 2 service discovery routines in 0.001 seconds
static_configs: added targets: 2, removed targets: 0; total targets: 2

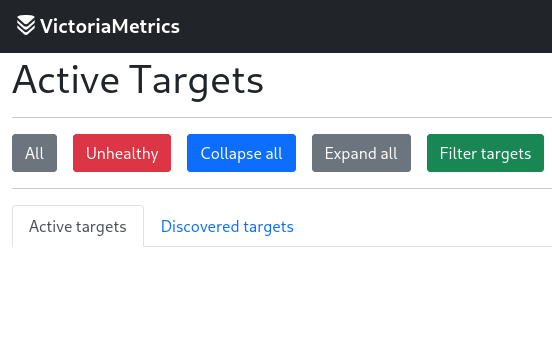
The targets should show up under /targets on the VictoriaMetrics, but sadly they don’t:
Screenshot From 2025-04-14 13-12-22

At journalctl -xeu victoriametrics.service I can’t find anything that seems off as well - except that the targets are never found of course.

Sorry that I forgot to bring up why everything’s configured stuff like that earlier. Thanks for the help though, glad I could add the plugin declaratively.

Ok, so it seems that I’ve fixed it.

I’m using this dashboard in Grafana.

And these are the nix config files:

# grafana.nix
{ config, pkgs, systemSettings, userSettings, ... }:

{
    services.grafana = {
        enable = true;
        settings = {
            server = {
                http_addr = "127.0.0.1";
                http_port = 2345; # default: 3000
                enable_gzip = true;
            };
            security.admin_email = systemSettings.extraSettings.email;
            analytics.reporting_enabled = false;
        };

        provision = {
            dashboards.settings.providers = [
                { name = "Overview"; options.path = "/etc/grafana-dashboards"; }
            ];

            datasources.settings = {
                apiVersion = 1;
                datasources = [
                    {
                        name = "VictoriaMetrics";
                        type = "victoriametrics-metrics-datasource";
                        access = "proxy";
                        url = "http://127.0.0.1:8428";
                        isDefault = true;
                    }

                    {
                        name = "VictoriaLogs";
                        type = "victoriametrics-logs-datasource";
                        access = "proxy";
                        url = "http://127.0.0.1:9428";
                        isDefault = false;
                    }
                ];
            };
        };

        declarativePlugins = with pkgs.grafanaPlugins; [
            victoriametrics-metrics-datasource
            victoriametrics-logs-datasource
        ];
    };
}
# victoriametrics.nix
{ config, pkgs, systemSettings, userSettings, ... }:

{
    # Default port: 8428
    services.victoriametrics = {
        enable = true;

        prometheusConfig = {
            global = {
            #     scrape_intervals = "10s";
            };
            scrape_configs = [
                {
                    job_name = "node-exporter";
                    # stream_parse = true;
                    scrape_interval = "60s";
                    static_configs = [
                        { targets = ["127.0.0.1:9100"]; labels.type = "node"; }
                    ];
                }
                {
                    job_name = "victoriametrics";
                    # stream_parse = true;
                    scrape_interval = "60s";
                    static_configs = [ { targets = ["http://127.0.0.1:8428/metrics"]; } ];
                }
            ];
        };
    };

    services.prometheus.exporters.node.enable = true;
}
# victorialogs.nix
{ config, pkgs, systemSettings, userSettings, ... }:

{
    # Default port: 9428
    services.victorialogs = {
        enable = true;
        extraOptions = [
            "-retentionPeriod=14d"
        ];
    };

    services.journald.upload = {
        enable = true;
        settings.Upload.URL = "http://localhost:9428/insert/journald";
    };
}

If anybody is interested in replicating this and has any questions, let me know. Also if anybody sees any issues I’d be happy to see other suggestions!