I’d love to use pef for profiling my application and the kernel. I am running perf as
$ doas perf record -g --call-graph dwarf my-app
$ doas chown  $USER perf.data
$ perf script -F +pid > perf_profile
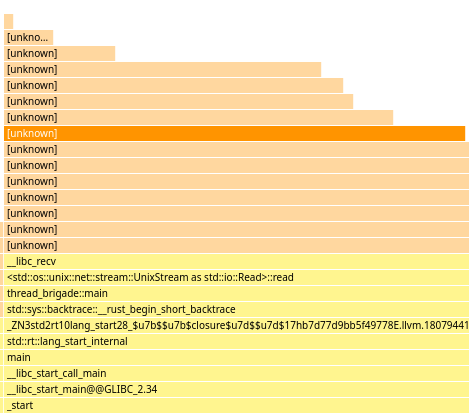
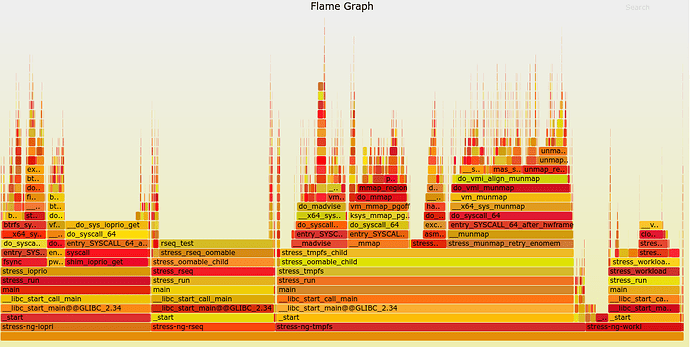
but the resulting profile includes symbolic names for my app only:

I think this is because I am missing debug symbols for my kernel.
How do I fix this problem?
