Yajo
September 22, 2023, 10:57am
1
I’m having a big closure that takes too much to evaluate. And it has no IFDs. That’s weird.
I’m used to using py-spy to generate flamegraph data that I can feed into https://www.speedscope.app/ to inspect and solve Python apps performance bottlenecks.
Is there anything similar for Nix lang?
5 Likes
I have this zsh function
function nixFunctionCalls {
    local WORKDIR=$(mktemp -d /tmp/nix-fun-calls-XXXXX)
    nix-instantiate --trace-function-calls "$1" -A "$2" 2> $WORKDIR/nix-function-calls.trace 1>/dev/null
    ~/nixgits/nix/contrib/stack-collapse.py $WORKDIR/nix-function-calls.trace > $WORKDIR/nix-function-calls.folded
    nix-shell -p flamegraph --run "flamegraph.pl $WORKDIR/nix-function-calls.folded > $WORKDIR/nix-function-calls.svg"
    echo "$WORKDIR/nix-function-calls.svg"
}
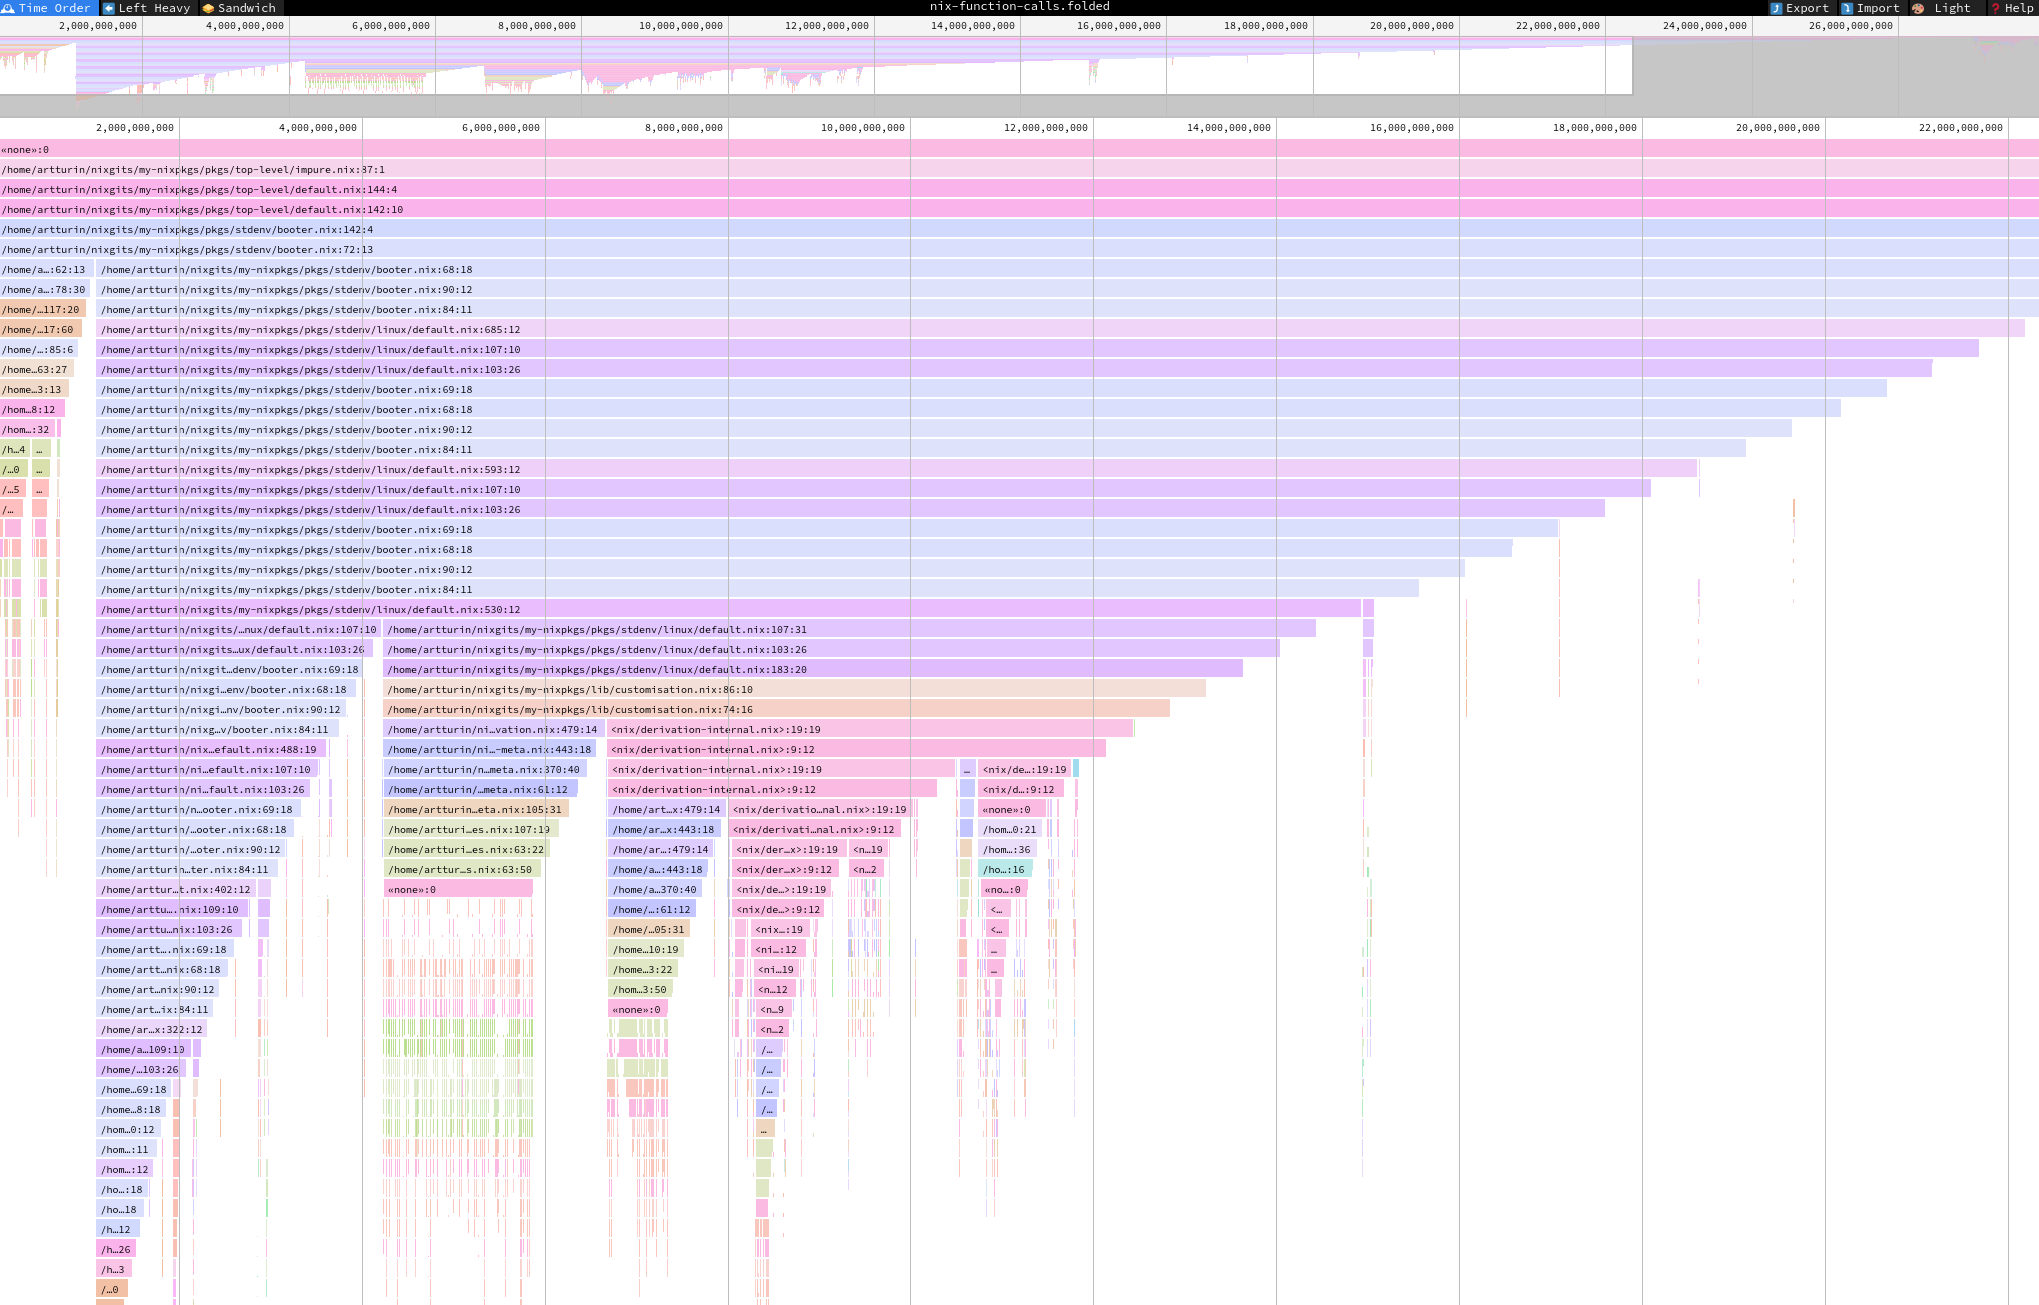
I use it like so nixFunctionCalls . bash | xargs firefox
here’s the .folded file in speedscope
16 Likes
Yajo
September 26, 2023, 9:53am
3
Is there a flakes alternative to nix-instantiate?
Yajo
September 26, 2023, 9:58am
4
I’m trying your solution and a problem I find is that my .folded file occupies about 59 GB, so I cannot upload it to speedscope, and trying to get a local flamegraph out of it blows my machine.
Is there any other more efficient way to get a flamegraph?
Mine for the nixpkgs bash is only a few mb
I dont know of other ways
From this replyhttps://github.com/NixOS/nix/issues/7179#issuecomment-1678230028
nix eval --trace-function-calls --raw ".#bash" 2>&1 | cat
For some reason it has to be piped, weird bug.
Yajo
September 26, 2023, 11:03am
7
py-spy has the notion of samples per second. I think that’s how they produce a reasonably-sized dump.
It seems to me that nix just traces every single call, which can amount to many millions when using modules (I have them while using flake-parts and dream2nix in the same project).
It would be nice to be able to have a “samples per second” option for --trace-function-calls.
NIX_SHOW_STATS=1 NIX_COUNT_CALLS=1 could also be helpful
1 Like
Yajo
September 27, 2023, 8:06am
9
Both options seem to dump useful information, but it’s not very human-readable.
Is there any tool that generates some sort of graphic out of that data?
00000000: 0d1b 5b4b 0d1b 5b4b 6675 6e63 7469 6f6e  ..[K..[Kfunction
00000010: 2d74 7261 6365 2065 6e74 6572 6564 20c2  -trace entered .
Nix is putting control chars in stderr for some reason. After cleaning up the control characters and passing it through this very jank AI-generated script , flamegraph.pl is able to generate svgs.
EDIT: Nevermind, the script doesn’t produce correct results. But it should be easy enough to do.
Adapted to home-manager configuration, made it use nix run to support flakes and inferno for magnitudes faster svg generation:
 home.packages =
      let
        # https://discourse.nixos.org/t/nix-flamegraph-or-profiling-tool/33333
        stackCollapse = pkgs.writeTextFile {
          name = "stack-collapse.py";
          destination = "/bin/stack-collapse.py";
          text = builtins.readFile (builtins.fetchurl
            {
              url = "https://raw.githubusercontent.com/NixOS/nix/master/contrib/stack-collapse.py";
              sha256 = "sha256:0mi9cf3nx7xjxcrvll1hlkhmxiikjn0w95akvwxs50q270pafbjw";
            });
          executable = true;
        };
        nixFunctionCalls = pkgs.writeShellApplication {
          name = "nixFunctionCalls";
          runtimeInputs = [ stackCollapse pkgs.inferno ];
          text = builtins.readFile ./nix-function-calls.sh;
          checkPhase = "";
        };
      in
      [ nixFunctionCalls ];
#!/usr/bin/env zsh

WORKDIR=$(mktemp -d)

nix eval -vvvvvvvvvvvvvvvvvvvv --raw --option trace-function-calls true $1 1>/dev/null 2> $WORKDIR/nix-function-calls.trace
stack-collapse.py $WORKDIR/nix-function-calls.trace > $WORKDIR/nix-function-calls.folded
inferno-flamegraph $WORKDIR/nix-function-calls.folded > $WORKDIR/nix-function-calls.svg
echo "$WORKDIR/nix-function-calls.svg"
4 Likes
thanks a lot for posting it here, can you please explain to me why the pipe xargs command?
like in your example:
nixFunctionCalls . bash | xargs firefox
thanks!
norpol
March 12, 2024, 1:56pm
13
If you pipe this to xargs firefox it will be the equivalent of firefox ./$WORKDIR/nix-functiona-calls.svg.
1 Like
norpol
March 12, 2024, 2:02pm
14
Some additional ongoing efforts/experiment for a Nix expr evaluation profiler using tracy:
NixOS:master ← picnoir:pic/tracy-profiler
opened 09:09AM - 08 Feb 24 UTC
This is a WIP profiler for the Nix code itself, not the cpp Nix evaluator. The g… oal is to provide some tooling to improve the Nixpkgs evaluation performance.
This is a WIP Nix profiler using [Tracy](https://github.com/wolfpld/tracy). The idea is to trace the evaluation of the expression atoms to figure out what is expensive. We are roughly tracing the thunk evaluation. Nix is a lazy language, I think this is what makes most sense.
[Short demo video](https://social.alternativebit.fr/media/4fee7e0b64e3d7fd05102e2d3b6789099ceb506c6cd9fe4398efd5aea2e13779.nix-tracy-demo-short)
## TODO before Undrafting
This is not ready yet. We need to fix at least those two issues before undrafting this PR.
**HELP WELCOME** :)
### Elephant in the room: tracy SEGFAULTS!!!!!!!!!
We have those weird "???" frames in Tracy. Hovering them with the mouse segfault the viewer.
Removing the line and the column in the position pretty printer makes them go away. Sadly, removing the column and position from the trace also makes the profiler useless :D
There's something very wrong in our client code, but I couldn't figure out what. For now. This is the first item on my TODO list.
### Profiler performance
There's room for improvement. Random datapoint, with the profiler enabled:
```
[nix-shell:~/code-root/github.com/NixOS/nix]$ time ./outputs/out/bin/nix-instantiate -A nixosTests.pleroma ../nixpkgs
warning: you did not specify '--add-root'; the result might be removed by the garbage collector
/nix/store/z6nqb4zkx59hqn00rpzpzq4fcp34y9pa-vm-test-run-pleroma.drv
real 1m41,835s
user 2m51,728s
sys 0m11,388s
```
Without the profiler:
```
[nix-shell:~/code-root/github.com/NixOS/nix]$ time nix-instantiate -A nixosTests.pleroma ../nixpkgs
warning: you did not specify '--add-root'; the result might be removed by the garbage collector
/nix/store/z6nqb4zkx59hqn00rpzpzq4fcp34y9pa-vm-test-run-pleroma.drv
real 0m12,478s
user 0m9,998s
sys 0m1,431s
```
That's not a surprise, I did not make any effort here, each profiler macro is generating **at least** 3 allocations.
We should run perf on this and see what's wrong.
### Move out the trace macros from the eval call sites
See https://github.com/NixOS/nix/pull/9967#issuecomment-1933695607
### Is this useful/refine design?
We should spend some time using this profiler. Can we spot issues with it? Can we remove some useless noise from the traces?
There's no magic trick here, we need to spend time using the tool to improve it.
## How to test?
1. `nix build github:picnoir/nix/pic/tracy-profiler`
2. Open tracy. `nix-shell -p tracy`. Then, either lauch the graphical profiler to watch the capture in real time (`tracy`), either record the run through the headless capture utility (`capture -o capture.tracy`).
3. Evaluate something with the `nix-instantiate` utility you built in step 2. EG. `./result/bin/nix-instantiate -A nixosTests.pleroma path-to/nixpkgs/`
4. Enjoy the [operation game](https://en.wikipedia.org/wiki/Operation_(game)), avoid the `???` with your mouse to prevent segfaults. Scroll-wheel to zoom/unzoom, left click to move the trace.
# Priorities and Process
Add :+1: to [pull requests you find important](https://github.com/NixOS/nix/pulls?q=is%3Aopen+sort%3Areactions-%2B1-desc).
The Nix maintainer team uses a [GitHub project board](https://github.com/orgs/NixOS/projects/19) to [schedule and track reviews](https://github.com/NixOS/nix/tree/master/maintainers#project-board-protocol).
1 Like
ada
December 4, 2024, 9:31pm
15
in case any of you are interested, I went ahead and cobbled together the scripts @tailrecursive posted into an easily accessible nix flake. You can find it here: GitHub - crabdancing/nix-flamegraph: Various primitive scripts cobbled together to produce an easy flamegraph of nix eval
3 Likes