For a while now my rebuilds have been taking longer than I’d really like. I use nh os switch for rebuilding and switching configurations, and it takes about a minute and a half on average for '.#nixosConfigurations.laptop.config.system.build.toplevel' to be built. However, I don’t know how to profile any further and figure out what is causing the slow down.
nh does provide a handy view of the dependency tree but that comes after the minute or so from the nix build I mentioned above. I have already pruned software that takes a while to set up which I don’t use often enough to warrant keeping it in my configuration.
If there isn’t a way to profile further, are there any general rules-of-thumb for things that may take a while and ways to optimise them?
check how many times you’re evaluating nixpkgs. each flake you set as an input is likely pulling in it’s own copy of nixpkgs. use inputs.${input}.inputs.nixpkgs.follows = "nixpkgs"; judiciously to avoid evaluating nixpkgs over and over.
FYI: the follows derivative just sets that they point to the same rev, AFAIK there are likely still two instances.
So if a flake does something like pkgs = import inputs.nixpkgs {} or similar, that is still a new evaluated instance, nevertheless if you follow and input or not.
A lot of those will likely result in a longer eval time.
For whatever reason, eval time has dropped to ~25 seconds which isn’t awful but I have found that a single package (haskell-language-server) is taking up a lot more time than other packages to eval (~10% of overall eval time).
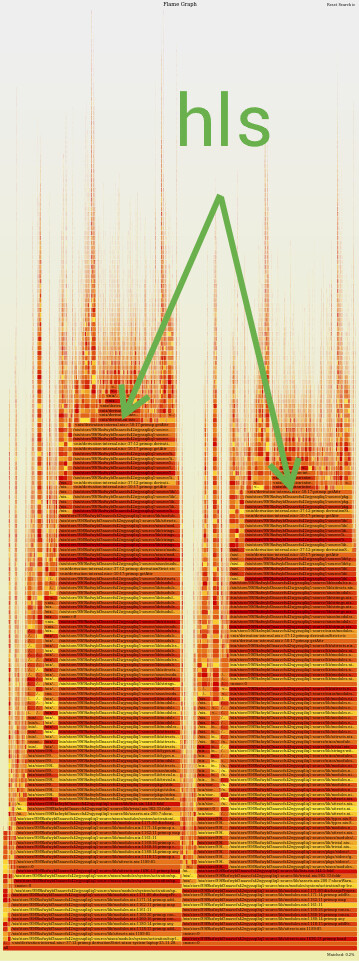
edit: it is now back to ~1m30. 24% of which is haskell-language-server. I have no idea why:
Is it possible that you forgot the --no-eval-cache option?
I think because hls is a big package in terms of dependencies. For me it takes about 8.5s to eval when tested in isolation, compared to 0.6s for pkgs.hello (nixpkgs rev 00c21e4c9).
If you have multiple GHC versions in the supportedGhcVersions argument of pkgs.haskell-language-server then it will take still longer to eval. I think this could explain the two humps in your flamgraph.
However, if you have other Haskell packages in your NixOS closure, then they will potentially share dependencies with HLS, effectively spreading the evaluation cost.
For a while now, I have installed HLS into my ~/.nix-profile (i.e. with nix profile add my-config#my-haskell-env), keeping it separate from NixOS configuration. This was for other reasons, but I now realise that it helps reduce nixos eval time.
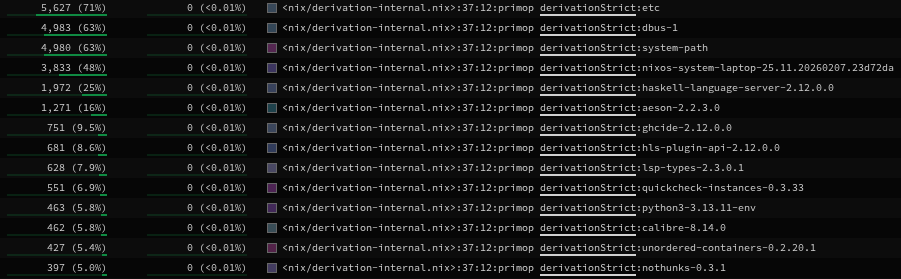
For viewing the profile and listing slow packages, I also use the speedscope.app Sandwich View, press Ctrl-F to filter on derivationStrict, then sort by Total samples. It’s not ideal because derivation inputs need to be considered when judging packages – flamegraph.pl shows this on the y-axis.
Unfortunately not the issue (as it went back up to ~1m30 afterwards, for whatever reason).
Is it really that bloated? It’s 4-5x any other package on my system and I thought I had a few pretty dependency heavy packages.
I mean the two humps seem to not just be because of hls. I checked the flamegraph with and without my Haskell module. I also don’t think I have multiple GHC versions: