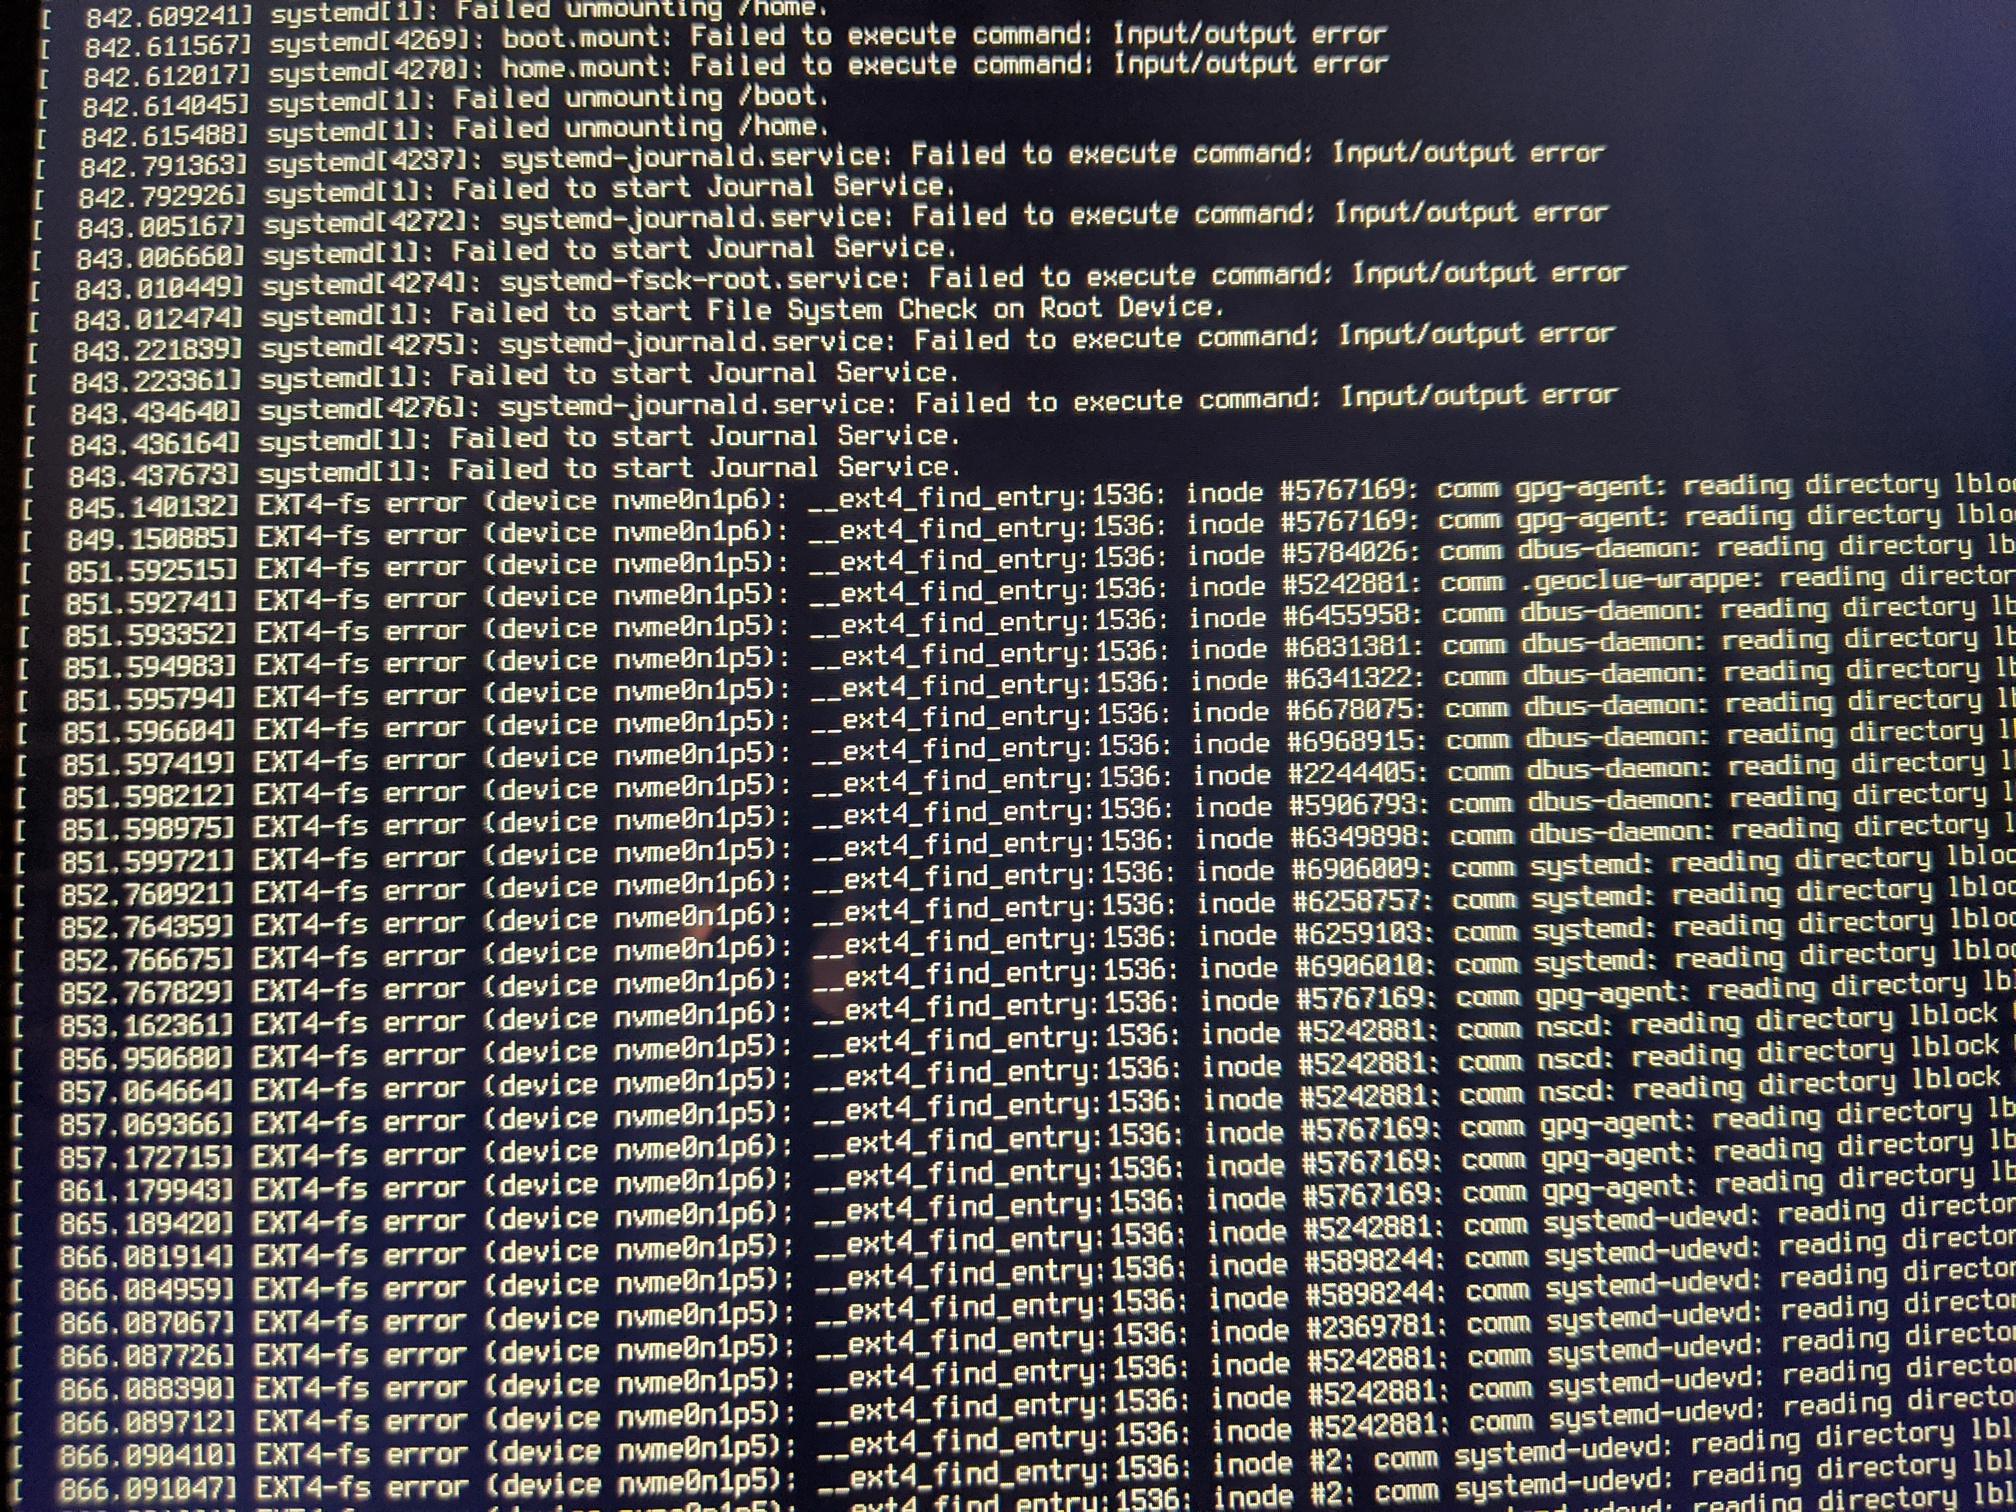
NixOS on my Lenovo Yoga C930 laptop will just freeze suddenly from time to time, with no warning, and totally at random, i.e. not while I’m doing anything necessarily compute-intensive, and not while I’m running a particular program. When it fails, everything locks up, and then I get several screenfulls of errors. I can’t screenshot them, and they’re not in journalctl, but I did take a picture of them:
I can’t really make sense of them.
In fact, my system has hard-frozen twice, while I’ve been typing this post.
Here’s what I think the problem is not:
- My hard drive, since I just replaced it with a new one a few month ago.
- The filesystem, since I just formatted the partition, and reinstalled NixOS. I also just ran
fsck on everything, and it came up clean.
- Overheating, since this will happen on a fresh boot, as well, when I’m barely running anything
- Overloading of RAM, since I have 12G of RAM and have not been running very many things.
My configuration.nix is up here on GitHub.
Any ideas what this could be?
Edit: a few things more I could say about this issue include:
- When my system freezes, it seems to do so slowly, like over the course of thirty seconds. First, clicking on a browser tab, or typing a command will just stop working, but the rest of the system will seem to continue working.
- After I hard-reset it, it then freezes again within a few minutes of rebooting it. It usually freezes one more time, too, on the next reboot. So basically, every time it freezes, it actually freezes three times.
Even if your hardrive itself is not broken, it could be an issue with it’s slot which is inherited to the laptop. I’d try to use this hardrive with NixOS on it on a different box and see if the problem persists with that box’ hardware.
Your RAM might be faulty, though. Have you run memtest?
1 Like
I hope you’ve tried fsck with -f, some FS errors are sneaky. Also +1 for memtest suggestion of @ajs124.
Yet if it’s consistently failing with same pattern, you might want to check the health of your disk too.
I just ran it, in four passes. No errors.
I just ran nvme, and it gave me this:
Smart Log for NVME device:nvme0n1 namespace-id:ffffffff
critical_warning : 0
temperature : 32 C
available_spare : 100%
available_spare_threshold : 10%
percentage_used : 0%
endurance group critical warning summary: 0
data_units_read : 5132703
data_units_written : 5973349
host_read_commands : 161664113
host_write_commands : 92998036
controller_busy_time : 1571
power_cycles : 566
power_on_hours : 917
unsafe_shutdowns : 428
media_errors : 0
num_err_log_entries : 0
Warning Temperature Time : 0
Critical Composite Temperature Time : 0
Thermal Management T1 Trans Count : 0
Thermal Management T2 Trans Count : 0
Thermal Management T1 Total Time : 0
Thermal Management T2 Total Time : 0
I don’t really understand all of it, but it seems to be normal, no? Apart from the fact that I’ve had to unsafely poweroff my system over 400 times, due to this bug / freeze.
I just ran it. Apart from a couple inodes it thought could be narrower (don’t know what that means), everything ran fine.
Looks OK. Sadly I don’t have too many ideas after this point. Assuming you have persistent logging, could you check journalctl -k and see if any unusual complaints from kernel on failure times (apart from inode errors, possibly before those).
did you ever find a solution?
I have a similar issue.
Only my system only crashes like 50 % of the time 5 Minutes after i boot or unlock my screen.
Looks like I have the same issue on the current stable branch - on a thinkpad p16s
I am using aAdata XPG SX6000 Pro M.2 NVMe . Filesysten and hardware seem to be fine.
Anyone a hint on how to approach this?